Schlatte wrote:do you mean like a frequency by harmony graph? I don't get it... or amplitude by harmony?


im not sure what is frequency by harmony or what you mean by it. The graph would have frequncy on the x axis and amplitude on the y axis. aka taking the fourier transform of a time series. or use PMTM or some other spectrral estimation technique. Fourier transform will easily be the most popular because it can be done using a technique known as FFT (Fast Fourier Transform) which is a particular implementation that is faster to compute using ... computers.
It is to me, 'the frequency domain representation' of a signal.
AC128 wrote:I want a fuzz that turns a sine wave into this


You could do this no problem with dsp and a look up table. Basically just map the transfer function. Imagine you sample and get a value x. somewhere there is a chart that says: value x maps to value y, the output. It can be completely bizarre and non linear, who cares, you just make a map and thats it. I will try to demonstrate when i have time. Of course doing things analog is always sexier, but this could be used as a brute force technique, or hjsut for experimenting, ie "what would that sound like"
also check out Falstads other applets if your into physics. the guy is a total genius, some great ways to visualize theory and also a great online circuit simulator.
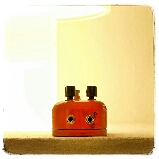
http://www.falstad.com/mathphysics.htmlAlso yes there are lots of programs that can do FFT. there are probably ones online that do it for you but if you want send me the data and i will try to import it into matlab or some other software i have. I have a cheap usb oscillocope that actually does FFT in 'real time' to the signal going in. I will try to make a screen capture with a teh crowther hotcake to see whats what
")
. Its not perfect but again, just to get an idea.


") .
.